
Introduction
In this IronPython script, we are building a simple Model Checker application with a graphical user interface using Windows Forms. The application has three tabs, each representing different functionalities related to model data, schedules, and control.
Setting up the Environment
The script begins by importing the necessary libraries and modules. Key libraries include System.Windows.Forms for GUI components, System.Drawing for graphical elements, and additional libraries for data manipulation (pandas), web browsing (webbrowser), and Excel handling (openpyxl). The emoji module is used to add emojis to the window title.
Creating the Main Form
The Create Window class inherits from the Form class, providing the foundation for the application's main window. The window is initialized with specifi properties such as title, size, minimum size, centering, background color, and opacity.
Designing the Tab Control
A Tab Control is added to the form to organize content into tabs. Three tabs are created, each representing a different aspect of the Model Checker application: "MODEL DATA," "SCHEDULE," and "CONTROL."
Customizing Tab 1: MODEL DATA
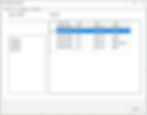
Tab1 includes a combo box for selecting a model, a panel for additional parameters with checkboxes, and a DataGridView to display model data. The DataGridView's background color is set to white, and sample data is populated. A help button and a login button are added to the bottom right corner.
Customizing Tab2: SCHEDULE
Tab2 features a combo box for selecting a schedule and a DataGridView to display schedule data. Similar to Tab 1, the DataGridView's background color is set to white, and sample data is populated.
Customizing Tab 3: CONTROL
Tab 3 follows a similar structure with a combo box for control selection and a DataGridView for displaying control-related data. User interface gives us the chance to examine and manipulate data in the same location. Dynamo player is not neccessary for selecting input elements for script.
Adding tab buttons
Adding combobox
Adding radio button
Adding help link
Adding data table
Full Code:
import clr
# import windows form
clr.AddReference("System.Windows.Forms")
#import system drawing
clr.AddReference("System.Drawing")
clr.AddReference("System.Data")
clr.AddReference("System.IO")
clr.AddReference("System.Threading")
clr.AddReference("System.Reflection")

sys.path.append(r'C:\Users\okorkmaz\AppData\Local\python-3.9.12-embed-amd64\Lib\site-packages')
import pandas as pd
import webbrowser
# import system
import System
import System.IO
import System.Drawing
import System.Reflection
import System.Windows.Forms

from System.Windows.Forms import *
from System.Drawing import *

from System.Data import DataColumn, DataRow
from System import EventHandler
from System.Data import DataTable, DataColumn, DataRow
# Import openpyxl
import openpyxl
from System.Windows.Forms import Application, Form, ComboBox, Label, TabControl, TabPage, PictureBox, Button, DataGridView, DataGridViewCellStyle

class CreateWindow(Form):
    def __init__(self):
        super(CreateWindow, self).__init__()

        self.icon = wx.Icon("taskbaricon.ico", wx.BITMAP_TYPE_ICO)
        self.SetIcon(self.icon)

        self.Text = " 🌎 MODEL CHECKER"
        self.Size = Size(800, 600)  # Sabit bir boyut belirleyin
        self.MinimumSize = Size(800, 600)  # Minimum boyutu belirleyin
        self.CenterToScreen()
        self.BackColor = System.Drawing.Color.FromArgb(255, 255, 255)

	      # Create a TabControl
        self.tabControl = TabControl()
        self.tabControl.Parent = self
        self.tabControl.Location = Point(10, 10)
        self.tabControl.Size = Size(770, 520)

        # Sample data for the DataGridViews
        data1 = [
            ["Autodesk sample model", "% 60","2023-12-13","Service"],
            ["Autodesk sample model", "% 95","2023-12-13","Office"],
            ["Autodesk sample model", "% 80","2023-12-13","Service"],
            ["Autodesk sample model", "% 60","2023-12-13","Egrees"],
            ["Autodesk sample model", "% 40","2023-12-13","Public Restroom"],
            ["Autodesk sample model", "% 60","2023-12-13","Office"]
        ]

        data2 = [
            ["Autodesk sample model", "% 60","2023-12-13","Service"],
            ["Autodesk sample model", "% 95","2023-12-13","Office"],
            ["Autodesk sample model", "% 80","2023-12-13","Service"],
            ["Autodesk sample model", "% 60","2023-12-13","Egrees"],
            ["Autodesk sample model", "% 40","2023-12-13","Public Restroom"],
            ["Autodesk sample model", "% 60","2023-12-13","Office"]
        ]

        data3 = [
            ["Autodesk sample model", "% 60","2023-12-13","Service"],
            ["Autodesk sample model", "% 95","2023-12-13","Office"],
            ["Autodesk sample model", "% 80","2023-12-13","Service"],
            ["Autodesk sample model", "% 60","2023-12-13","Egrees"],
            ["Autodesk sample model", "% 40","2023-12-13","Public Restroom"],
            ["Autodesk sample model", "% 60","2023-12-13","Office"]
        ]

        # Customize the appearance of the cells
        style = DataGridViewCellStyle()
        style.BackColor = System.Drawing.Color.LightGray

        # Create the first tab
        self.tab1 = TabPage()
        self.tab1.Text = "MODEL DATA"
        self.tabControl.TabPages.Add(self.tab1)

         # Create a panel in Tab 1 for additional parameters
        self.panel1 = Panel()
        self.panel1.Location = Point(30, 130)
        self.panel1.Size = Size(200, 320)
        self.panel1.BorderStyle = BorderStyle.FixedSingle
        self.tab1.Controls.Add(self.panel1)

        # Create checkboxes in the panel for additional parameters
        self.checkbox1_tab1 = CheckBox()
        self.checkbox1_tab1.Text = "Param 1"
        self.checkbox1_tab1.Location = Point(10, 10)
        self.panel1.Controls.Add(self.checkbox1_tab1)

        self.checkbox2_tab1 = CheckBox()
        self.checkbox2_tab1.Text = "Param 2"
        self.checkbox2_tab1.Location = Point(10, 30)
        self.panel1.Controls.Add(self.checkbox2_tab1)

        self.checkbox3_tab1 = CheckBox()
        self.checkbox3_tab1.Text = "Param 3"
        self.checkbox3_tab1.Location = Point(10, 50)
        self.panel1.Controls.Add(self.checkbox3_tab1)

        self.checkbox4_tab1 = CheckBox()
        self.checkbox4_tab1.Text = "Param 4"
        self.checkbox4_tab1.Location = Point(10, 70)
        self.panel1.Controls.Add(self.checkbox4_tab1)


         # Create Label in Tab 1 (for "SCHEDULE")
        label2 = Label()
        label2.Text = "SELECT MODEL"
        label2.Parent = self.tab1
        label2.Location = Point(30, 10)

        # Create Label in Tab 1 (for "SCHEDULE")
        label1 = Label()
        label1.Text = "SCHEDULE"
        label1.Parent = self.tab1
        label1.Location = Point(250, 10)

        # Create ComboBox in Tab 1
        self.TypesComboBox1 = ComboBox()
        self.TypesComboBox1.Location = Point(30, 40)
        self.TypesComboBox1.Size = Size(200, 30)
        self.TypesComboBox1.DropDownHeight = 50
        self.TypesComboBox1.ItemHeight = 30
        self.tab1.Controls.Add(self.TypesComboBox1)

        # Create DataGridView in Tab 1 (for table)
        self.dataGridView1 = DataGridView()
        self.dataGridView1.Location = Point(250, 50)
        self.dataGridView1.Size = Size(500, 400)
        self.tab1.Controls.Add(self.dataGridView1)

         # Set the background color of the DataGridView to white
        self.dataGridView1.BackgroundColor = System.Drawing.Color.White

        # Customize the appearance of the cells
        style = DataGridViewCellStyle()
        style.BackColor = System.Drawing.Color.LightGray  # You can customize this color

        # Populate the DataGridView
        self.dataGridView1.ColumnCount = 4
        self.dataGridView1.Columns[0].Name = "Project Name"
        self.dataGridView1.Columns[1].Name = "Value"
        self.dataGridView1.Columns[2].Name = "Date"
        self.dataGridView1.Columns[3].Name = "Name"

        for row in data1:
            self.dataGridView1.Rows.Add(row)

        # Customize the appearance of the cells
        self.dataGridView1.Rows[0].DefaultCellStyle = style

        # Create the second tab
        self.tab2 = TabPage()
        self.tab2.Text = "SCHEDULE"
        self.tabControl.TabPages.Add(self.tab2)

        # Create Label in Tab 2 (for "SCHEDULE")
        label2 = Label()
        label2.Text = "SCHEDULE"
        label2.Parent = self.tab2
        label2.Location = Point(250, 10)

        # Create ComboBox in Tab 2
        self.TypesComboBox2 = ComboBox()
        self.TypesComboBox2.Location = Point(30, 50)
        self.TypesComboBox2.Size = Size(200, 30)
        self.TypesComboBox2.DropDownHeight = 50
        self.TypesComboBox2.ItemHeight = 30
        self.tab2.Controls.Add(self.TypesComboBox2)

        # Create DataGridView in Tab 2 (for table)
        self.dataGridView2 = DataGridView()
        self.dataGridView2.Location = Point(250, 50)
        self.dataGridView2.Size = Size(500, 400)
        self.tab2.Controls.Add(self.dataGridView2)

        # Populate the DataGridView
        self.dataGridView2.ColumnCount = 2
        self.dataGridView2.Columns[0].Name = "Name"
        self.dataGridView2.Columns[1].Name = "Value"

        for row in data2:
            self.dataGridView2.Rows.Add(row)

        # Customize the appearance of the cells
        self.dataGridView2.Rows[0].DefaultCellStyle = style

        # Create the third tab
        self.tab3 = TabPage()
        self.tab3.Text = "CONTROL"
        self.tabControl.TabPages.Add(self.tab3)

        # Create Label in Tab 3 (for "SCHEDULE")
        label3 = Label()
        label3.Text = "SCHEDULE"
        label3.Parent = self.tab3
        label3.Location = Point(250, 10)

        # Create ComboBox in Tab 3
        self.TypesComboBox3 = ComboBox()
        self.TypesComboBox3.Location = Point(30, 50)
        self.TypesComboBox3.Size = Size(200, 30)
        self.TypesComboBox3.DropDownHeight = 50
        self.TypesComboBox3.ItemHeight = 30
        self.tab3.Controls.Add(self.TypesComboBox3)

        # Create DataGridView in Tab 3 (for table)
        self.dataGridView3 = DataGridView()
        self.dataGridView3.Location = Point(250, 50)
        self.dataGridView3.Size = Size(500, 400)
        self.tab3.Controls.Add(self.dataGridView3)

        # Populate the DataGridView
        self.dataGridView3.ColumnCount = 2
        self.dataGridView3.Columns[0].Name = "Name"
        self.dataGridView3.Columns[1].Name = "Value"

        for row in data3:
            self.dataGridView3.Rows.Add(row)

        # Customize the appearance of the cells
        self.dataGridView3.Rows[0].DefaultCellStyle = style

        # Create a Help Button in the bottom right corner
        self.helpButton = Button()
        self.helpButton.Text = "?"
        self.helpButton.Location = Point(self.Width - 50, self.Height - 70)
        self.helpButton.Size = Size(30, 30)
        self.helpButton.Click += self.open_help_page
        self.Controls.Add(self.helpButton)

        # Create a Login Button in the bottom right corner
        self.loginButton = Button()
        self.loginButton.Text = "Login"
        self.loginButton.Location = Point(self.Width - 100, self.Height - 70)
        self.loginButton.Size = Size(70, 30)
        self.loginButton.Click += self.open_login_page
        self.Controls.Add(self.loginButton)

    def open_help_page(self, sender, event):
        webbrowser.open("https://example.com/help")

    def open_login_page(self, sender, event):
        webbrowser.open("https://example.com/login")

# Run the application
form = CreateWindow()
Application.Run(form)
OUT = form.values
Also you can add more functionalities to windows form. The user interface may need to be designed very differently depending on the purposes for which it is used.
The use of forms in dynamo is quite limited for complex tasks. wpf's designed with xaml can be used with python through pyrevit. After the interface is designed with Visual studio, it can be used in dynamo.
The data shapes package is built on this system. It allows many methods to be used together.
Look at : https://data-shapes.io/blog/
Conclusion
In summary, this IronPython script demonstrates the creation of a Model Checker application using Windows Forms. The graphical user interface is organized into three tabs, offering distinct functionalities related to model data, schedules, and control parameters. The design includes thoughtful elements such as combo boxes, panels with checkboxes for additional parameters, and DataGridViews for displaying relevant information.
The script utilizes a variety of libraries, including System.Windows.Forms and System.Drawing for GUI components, pandas for data manipulation, webbrowser for web navigation, and openpyxl for Excel handling. The emoji module adds a touch of creativity to the window title.
Each tab is tailored to specific tasks, providing a user-friendly experience. The DataGridViews are customized with a white background for better readability, and sample data is populated to showcase the application's capabilities.
Furthermore, the inclusion of help and login buttons enhances the application's accessibility, offering users the option to seek assistance or log in for additional features.
Developers can build upon this foundation, extending the application's functionalities and refining the user interface to meet specific requirements. Overall, this Model Checker application serves as a solid starting point for those exploring GUI development with IronPython and Windows Forms.